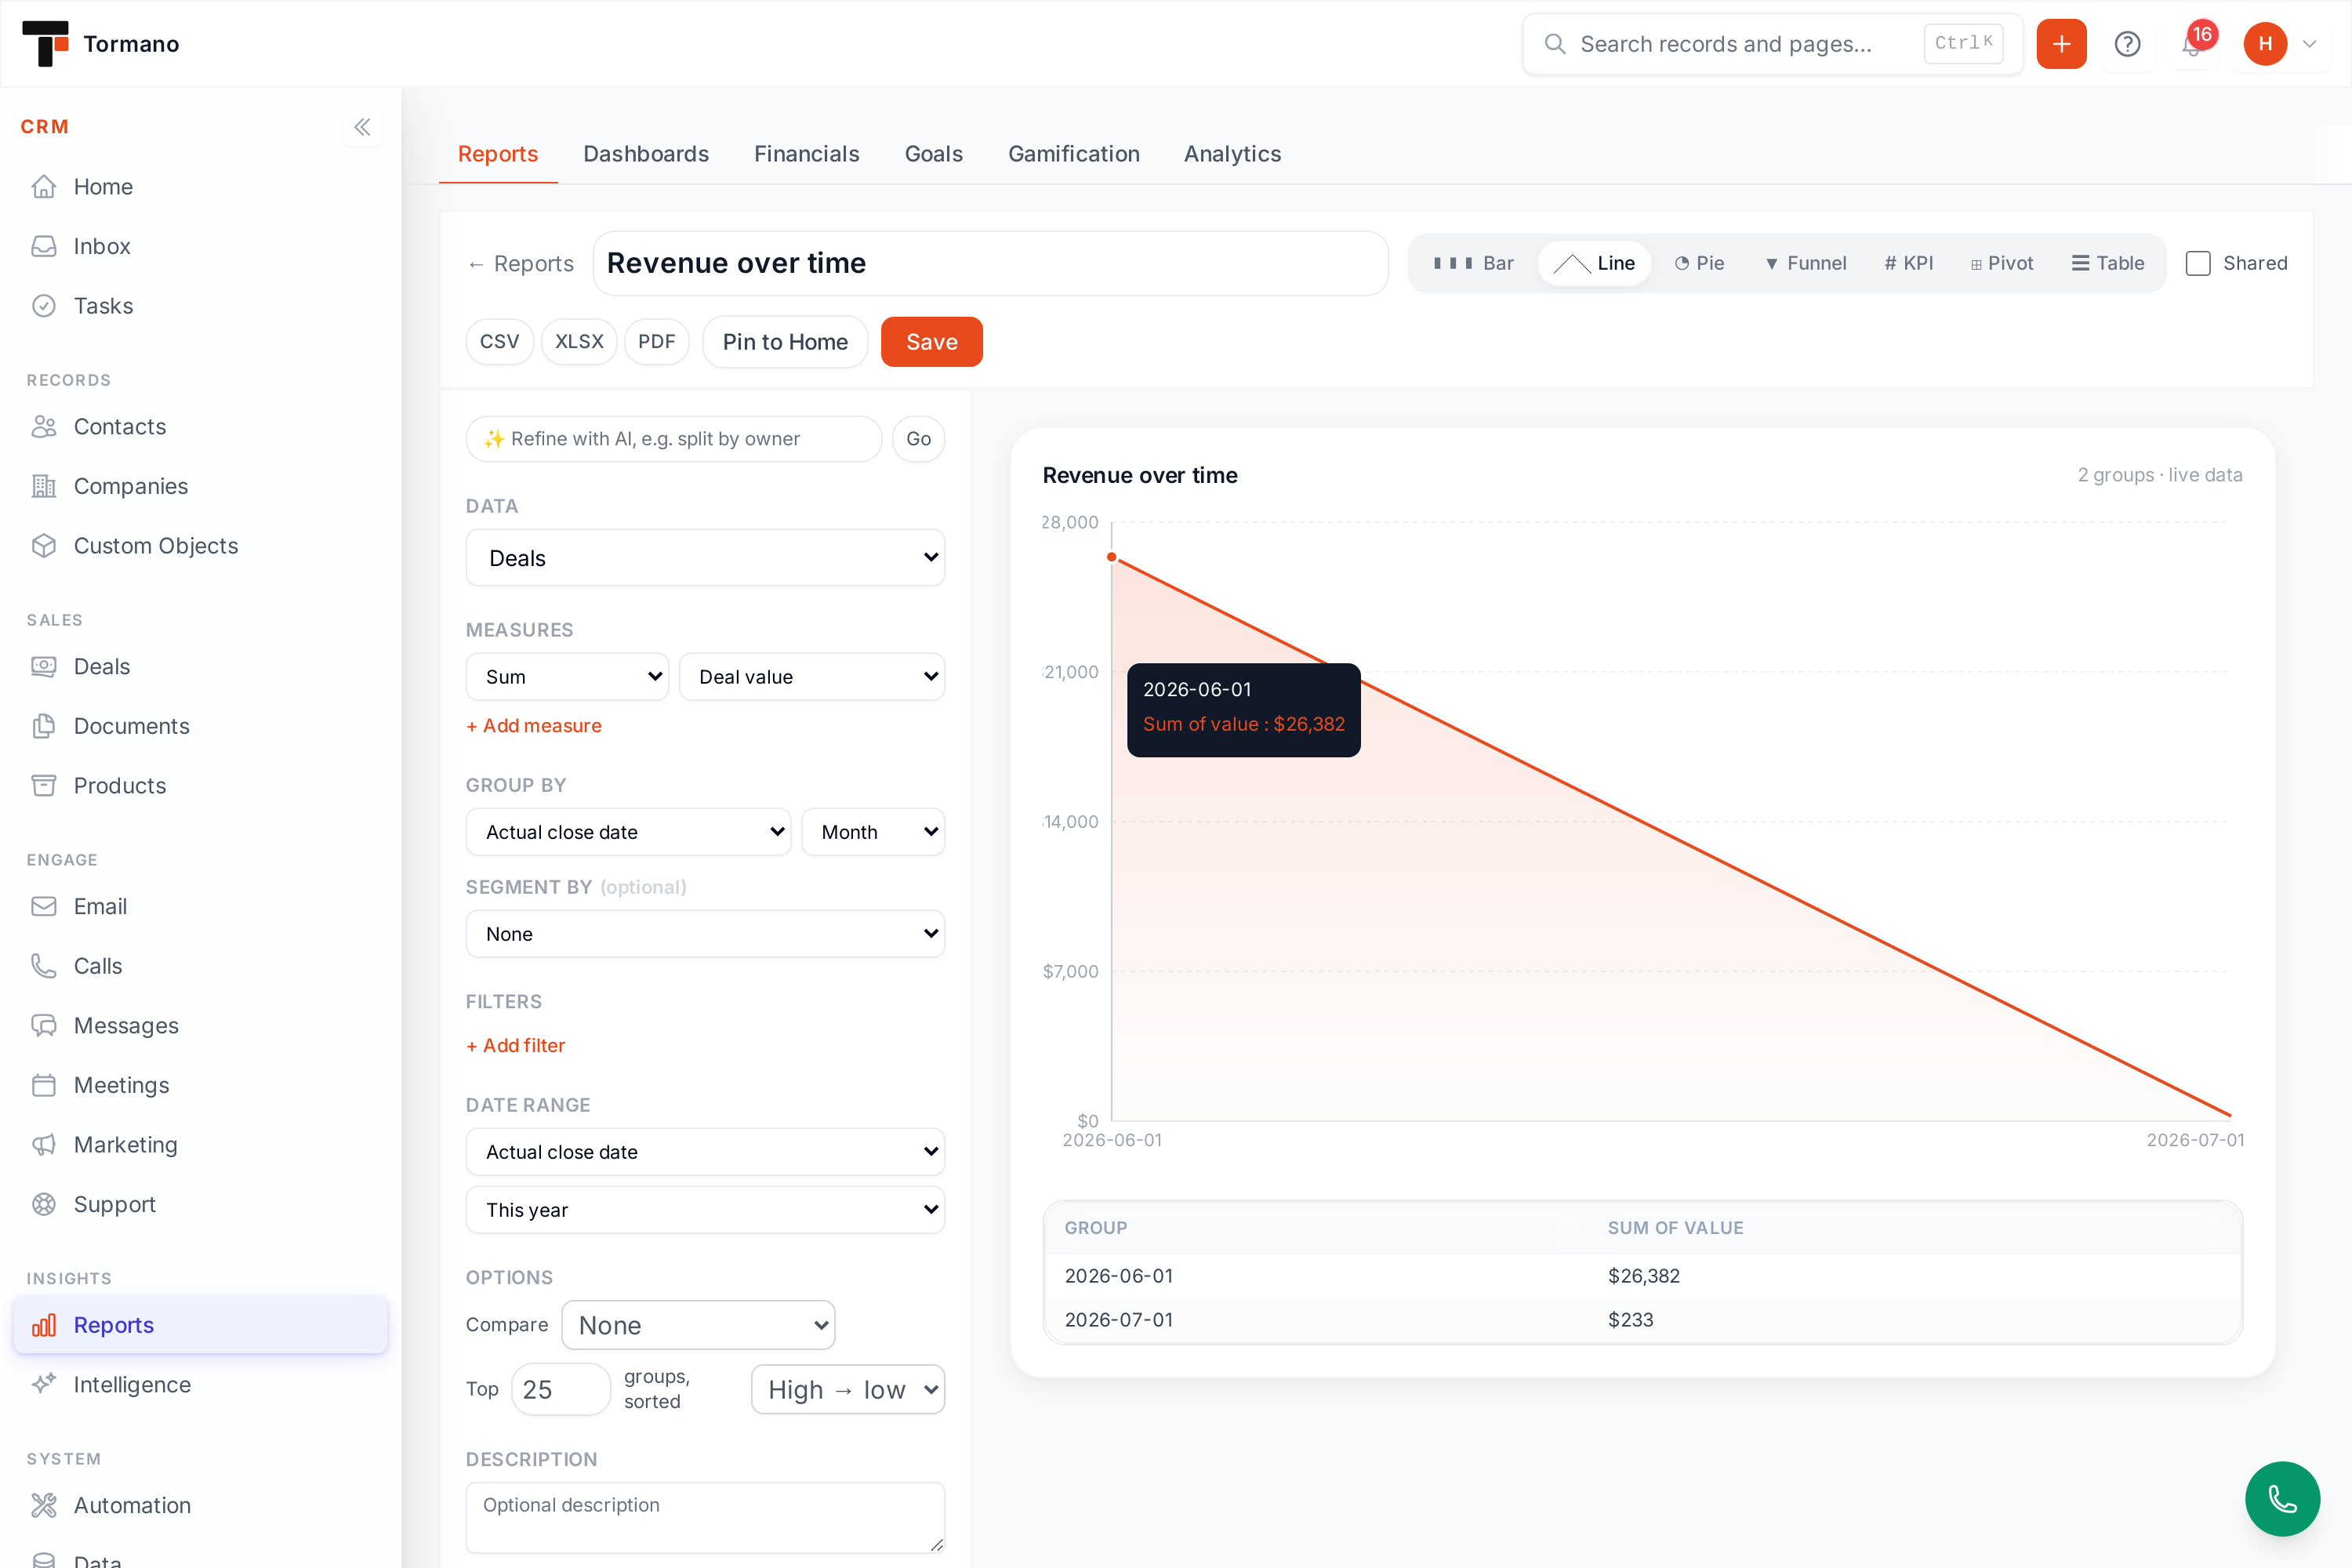
Report Studio
Pick any of 11 record types, add measures — count, distinct count, sum, average, median, min, max — group by any field with one-click date bucketing, and segment by a second field for stacked series. The chart updates live on every change, computed server-side over your full dataset, never a sample. Filters with 12 operators, custom-field support, top-N sorting, a variant-aware template gallery, bar, line, pie, funnel, KPI, and table views, one-click CSV, Excel, or PDF export, and Pin to Home.
Round two added period-over-period comparison (overlay the previous period or year), click-to-drill on any bar, slice, or point, and a Pivot view with row, column, and grand totals.
Describe the report. The AI builds it.
Type "total donations by fund this year as a bar chart" and Tormano builds the report. The AI is grounded in your actual field catalog so it cannot invent fields, every generated configuration is validated server-side before it reaches the studio, and you refine conversationally — "split by owner", "make it a pie".
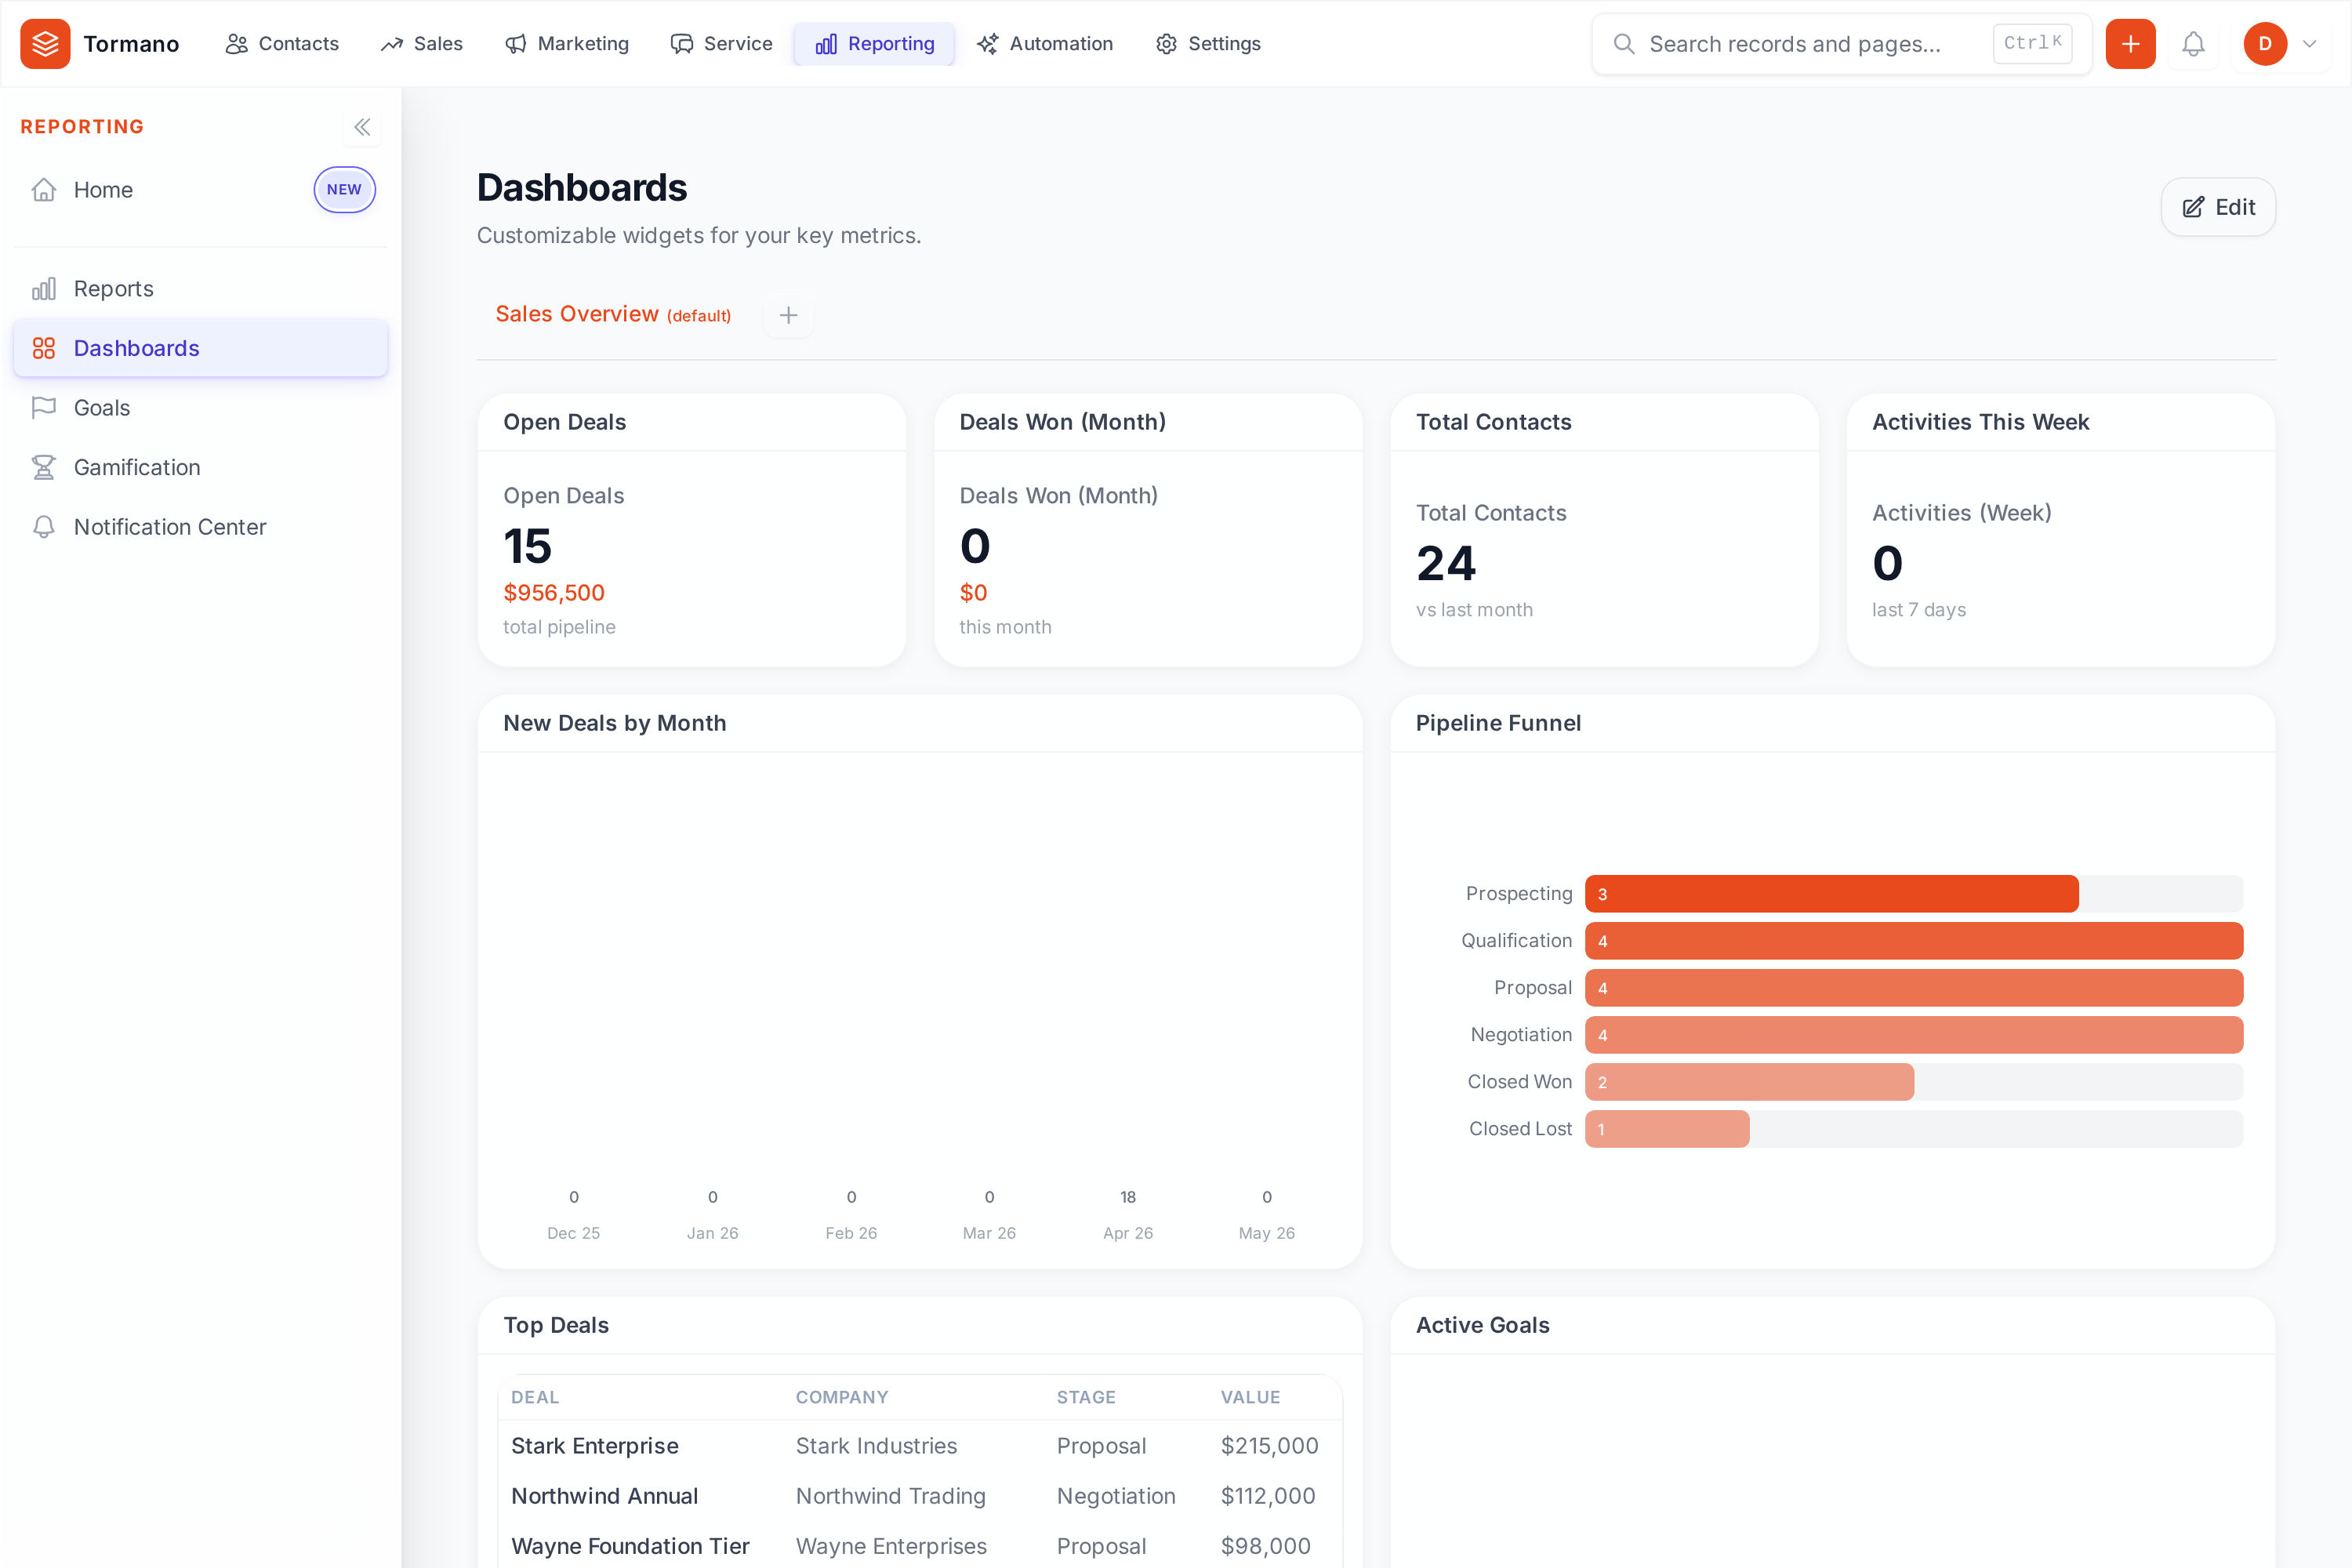
Dashboards with honest filters
Drag-and-drop dashboards with KPI cards, charts, funnels, tables, goals, and live QuickBooks financial widgets. Real interactive charts with tooltips, legends, and currency axes. A dashboard-wide date and owner filter applies across every widget server-side — and any widget a filter cannot apply to says so with an explicit badge instead of silently ignoring it. Sharing is real: teammates see a dashboard only when you share it.
Scheduled delivery
Email any report on a daily, weekly, or monthly cadence. The format you pick — PDF, Excel, or CSV — is the format that arrives, and delivery history records it.
Financial reports
P&L, Balance Sheet, General Ledger, Trial Balance, Cash Flow, aging, and revenue-by-campaign or fund, pulled live from QuickBooks with date filtering.
Nonprofit analytics
LYBUNT and SYBUNT, donor retention, the giving pyramid, campaign performance, and pledge summaries — scoped by fund, campaign, and comparison year.
Sales analytics
Pipeline conversion, deal velocity, stage duration, win rates, forecasting with three methodologies, and margin analysis computed from QuickBooks cost data.
See it with your own data.
14-day free trial, every feature unlocked. Connect QuickBooks, import your records, and run your real workflows. Cancel anytime.
Card required. Cancel anytime in settings before day 14.